Google Analytics for e-commerce – The most important metrics
Table of contents

Do you want to increase sales and build even better relationships with your customers?
“Data is the new oil” is a thesis put forward by The Economist and it is hard to disagree with it. Whoever has the data has power. The problem is that not everyone realizes how powerful a weapon is at their fingertips (i.e. within Google Analytics).
In 2020, there are fewer and fewer cases in which online stores do not use analytical tools, therefore, e-commerce without Google Analytics installed is a real rarity. However, it cannot be denied that these tools are treated neglectfully. Due to the lack of attention to this matter, marketers tend to give a quick look at the reports, without real analysis; then, they look at the sourcing report and decide either if everything is okay or if something is wrong, and leave it for later because now there is no time. At the same time, they decide to spend money on marketing activities, and as they are only guided by superficial data, it is not difficult to guess: this money is burned out.
In this article, I will present some reports in Google Analytics to help answer important questions about the marketing strategies of any e-commerce. Let’s get started!
Which products to advertise?
Imagine a situation in which you spend a lot of time, money, and energy promoting one of your products. You are satisfied because the campaign was profitable and the product you have chosen has been sold in large quantities.
But did you know that perhaps focusing only on this product was not your best decision? Thanks to data analysis, you are able to choose a product that has a higher conversion rate. This means that when generating the same amount of traffic, the product will be sold more.
Obviously, this report cannot be considered as binary. The fact that one of the products has a higher conversion rate does not immediately mean that it is definitely worth investing all your capital in it. First of all, take into account the size of the data sample, because it is difficult to compare products whose daily difference in views is counted in hundreds or thousands.
Also, pay attention to the type of product. You may find that it is part of or complementary to something else, which is why it has a higher conversion rate. It is simply sold as a package, complementary. As a result, it is displayed to people determined to buy it.
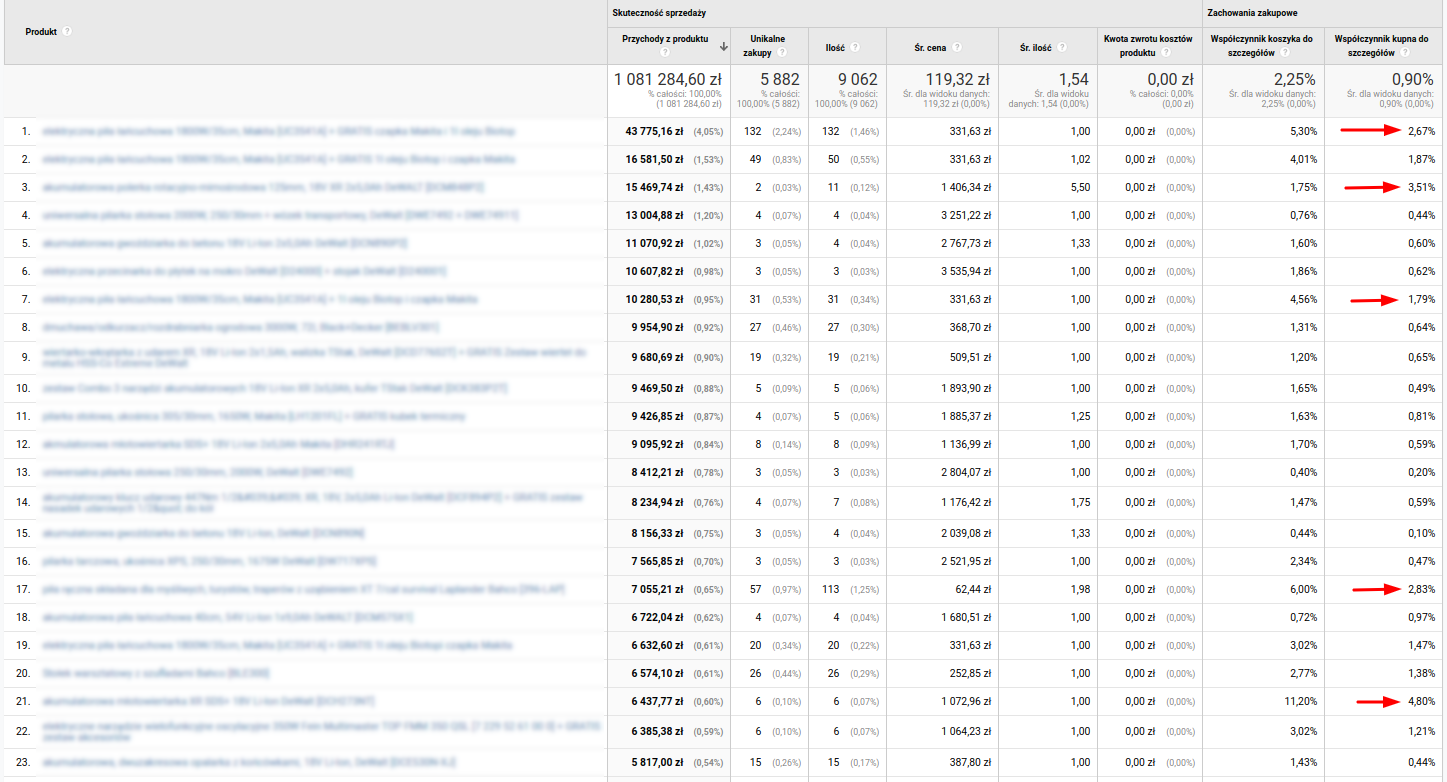
Take a look at the screen above. It shows several products that have an outstanding buy-to-detail rate. It’s definitely worth taking them under a magnifying glass. Analyze and maybe invest in their promotion?
Remember that in order for this report to be visible to you, the e-commerce report must be activated in your Google Analytics. A good compliment will also be the use of the Website Content report in the Behavior panel, in which we will find detailed statistics for individual subpages, which are often identical to products. Information such as the average time spent on each of them, the bounce rate and page value can help answer the question of which product to advertise.
Which marketing activities have an impact on making a purchase decision?
Sometimes I get the feeling that everyone in the industry knows about this report, yet few people spend time analyzing it. This is a mistake, quite significant.
Maybe I will present it on the example of a classic case of Facebook Ads activities, which in some industries do not cause an immediate purchase decision, but constitute the beginning of a sales funnel. They are an important piece in this puzzle. Meanwhile, many online store owners are suggested only by the source/medium report in the last-click attribution model, which means that most conversions are allocated to (direct)/(none), Google Ads/organic, or Google Ads/CPC campaigns for branded inquiries on the web search.
So is Google misleading us? No, this data is real. But the question arises: where did people who entered the link directly from the browser or entered the company’s name in google see about it? Exactly, for example from Facebook. If this piece was thrown out of the puzzle, the next one would not exist. Nobody would google the name of the store because they would not know about its existence.
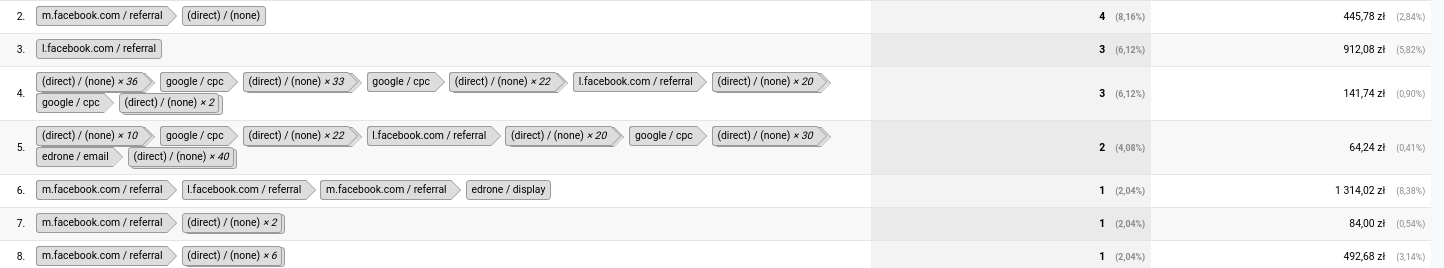
If you use e-mail marketing, this report may be especially useful for you if you are using edrone. Thanks to our partnership with Google, edrone users can see in this report people who opened the newsletter, but… clicked on it and finally entered the store’s website from another source. This allows you to properly look at and evaluate the quality of prepared newsletters. When reading them, many people open the store’s website in a new tab and make a purchase there, which effectively excludes interaction via e-mail from the shopping path. Thanks to edrone you will have access to more reliable results. Screen with functionality below.
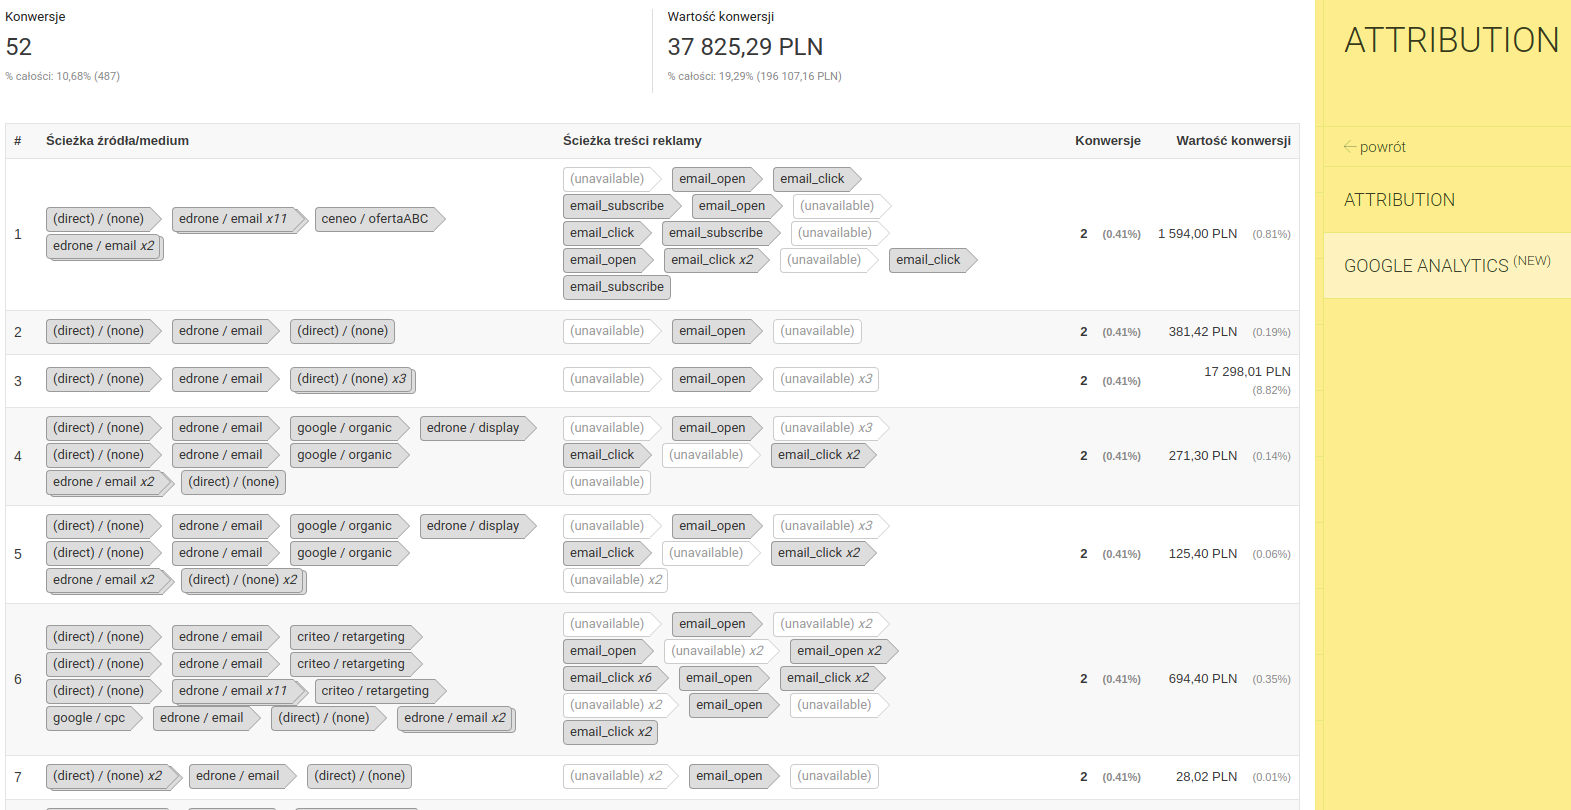
Analyzing the most popular Acquisition => Source/Medium report is also important, I do not advise against it. On the other hand, it’s important to try out different attribution models and look at this data more broadly than just a glance at what brings the last-stage conversions.
How do customers behave in your store?
In the Purchasing behavior report, we can see what the sales funnel looks like in the store. It is presented in a quite legible way, and also illustrates the division of new and returning customers.
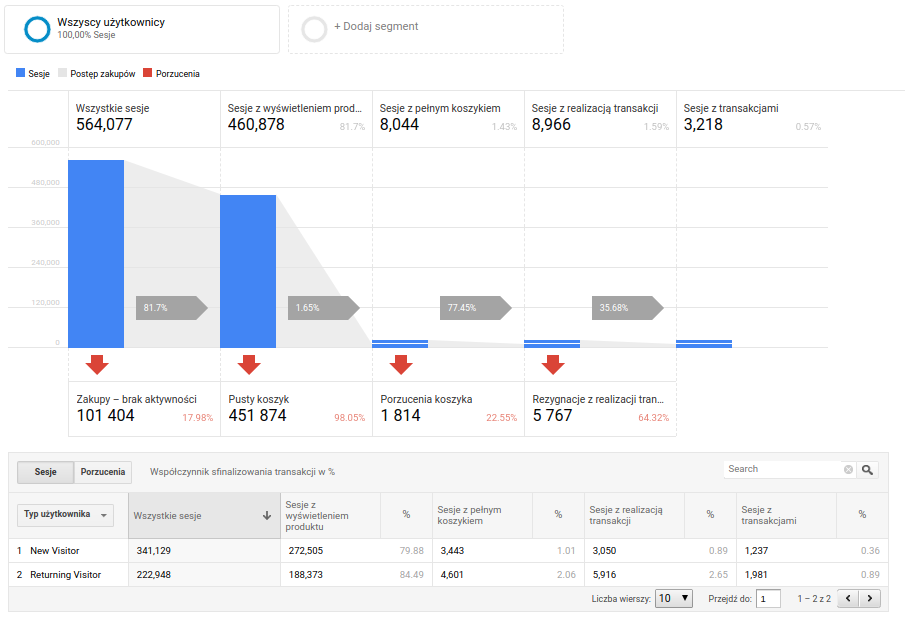
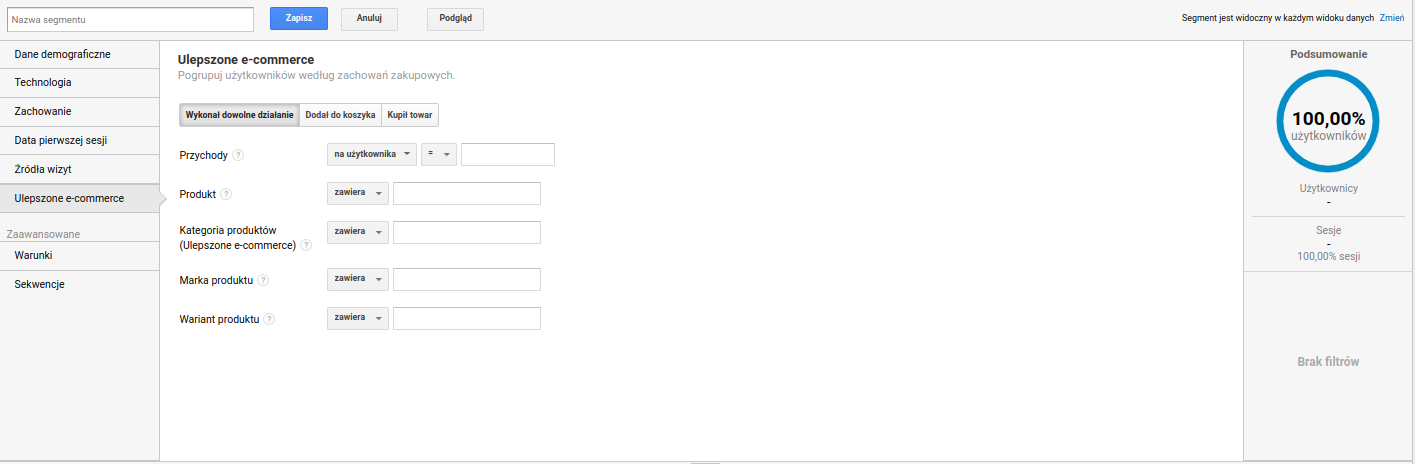
A useful option is the ability to create your own user segment. This allows us to analyze only selected users, i.e. only people whose input source is the newsletter or people who viewed specific products. There are many possibilities, it is worth playing with segmentation. Just click + Add Segment just above the chart.
Analyze multiple variables
Remember to take into account the data from many reports when assessing the effectiveness of your activities or establishing a store development strategy. Don’t look at them for zero-one because in e-commerce not everything is black and white. Don’t be afraid to take the time to do a detailed analysis or use the tools to help you to do so, as it will give you a lot in the long run. Probably a lot more than you will save on tools or time.
It is a great privilege to be able to see the data that your potential and current customers leave behind. If you want to be a leader in your segment, without proper analysis you will probably not succeed — unless you are incredibly lucky and every decision you make is right.

Jakub Papuga
Man with two faces. PPC Specialist & Business Analyst. Huge experience in Social Media Marketing and Google Ads. Fascinated by TechMarketing and Neuromarketing enthusiast.
Do you want to increase sales and build even better relationships with your customers?