

Do you want to increase sales and build even better relationships with your customers?
Which version of the newsletter will “sell” more? An A/B test will help make the right decision. By designing the test, one should take into account the sample size, expected conversion, statistical significance level and measurement time. Learn more about what else is worth paying attention to when planning and administering tests. What are […]
Which version of the newsletter will “sell” more? An A/B test will help make the right decision. By designing the test, one should take into account the sample size, expected conversion, statistical significance level and measurement time. Learn more about what else is worth paying attention to when planning and administering tests.
What are A/B tests?
They are a tool that allows us to compare two versions of a given solution and to evaluate which one brings better results. Testing can be applied to emails sent to our customers (see: Image 1), the layout of sub-pages of our e-store, the text of the „checkout” button, the banners and pop-ups, or the way in which products are presented in the mobile application. Everything can be tested in this way, provided that certain assumptions are met:
● We have an impact on what we are testing (this is obvious: it makes no sense to test something, if we will not be able to introduce the changes suggested after the test).
● We prepared two versions of a given solution for our users.
● We test one selected aspect of some solution (do not try to test everything at the same time).
● We can present each of the versions to comparable groups of users (very important!).
● We can measure how many users became acquainted with the individual variants (if we are testing a web site then it is the number of views of the given site variant, in the case of mailings we usually measure email opens).
● We can measure how many reacted in the desired way (variously defined depending on the goal of the marketing activities: it could be clicks on a link, likes, adding of a product to the shopping cart, making a purchase or evaluation of a product after the purchase).
● We accept that the A/B test is only a tool, which helps in our work, but does not release us from making the final decision.
Image 1. Example of messages prepared for A/B test, which differ in one detail.

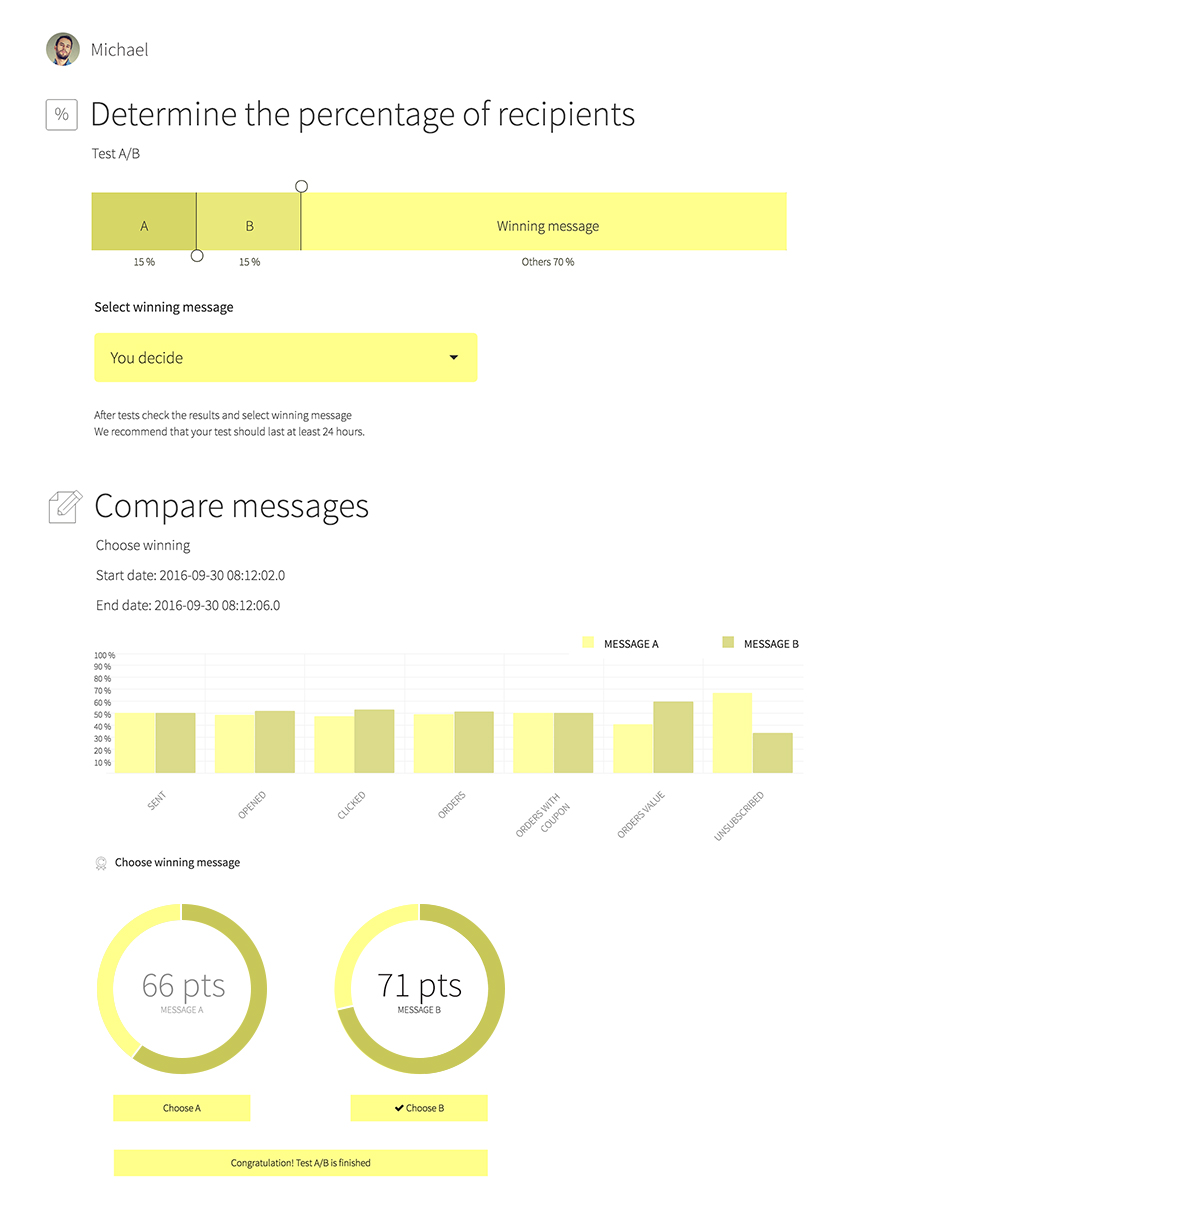
A situation that occurs often, is the testing of mailing variants. On the edrone platform we select ENGAGEMENTS-> NEWSLETTER A/B (see: Image 2). We create a new campaign or select a previously saved campaign. In the ADJUST section we select the percentage of recipients to which variant A and B will be sent. In the DESIGN section we define the template of the messages – separately for variant A and B. After that we proceed as in the case of a regular newsletter – we determine the sender, and possibly the coupons and the target group (audience).
Image 2. Mission Control Panel in edrone.
Size matters
The open rate of an average newsletter – the percentage of customers who become acquainted with it – is about 10%. In addition, our experience shows that 75% of users among those who have responded to the email (opened the message and/or clicked on the link in the message) did so in the first 24 hours after dispatch. The remaining 25% opened the email up to several days after the dispatch (see Figure 1).
Figure 1. Illustrative number of email opens in the first 24 hours.
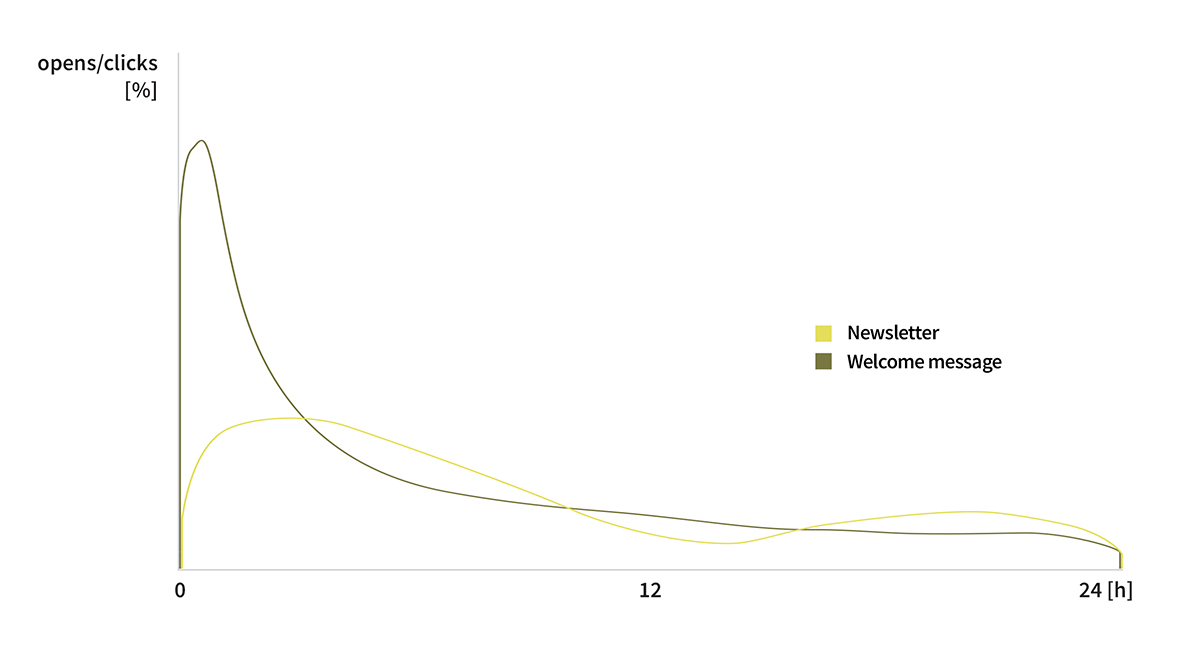
We can clearly see the greatest number of newsletter opens on the dispatch date and on the second day. The welcome message is opened immediately or not opened at all.
From the above facts we can draw two very important conclusions:
● the test should last one day (24 h) – it’s not worth to wait any longer
● 10% * 75% = 7.5% – this is the percentage of newsletter opens that we can expect on the second day
When we perform the test, we determine in a percentage value, what part of the database will the test be sent to. In order to estimate what number of emails directed to the test will be opened until the test is completed, the assumed 7.5% of responses obtained after 24 hours should be multiplied by the percentage of newsletters directed to the test and by the size of our database. Let’s assume that our database contains 100 thousand emails. In ADJUST-> „Determine the percentage of recipients” we set, for example, 10% for variant A and 10% for variant B (it is always the safest choice to test the same number for variant A and variant B). The test will include: 10% * 100 000 = 10 000 emails in variant A and the same number in variant B. In total we will send 20 000 emails. Out of this, after 24 hours we can expect 750 opens of emails in variant A and the same number in variant B (total of 1500 in both test groups).
Will the calculated number of emails which produce specific reactions of recipients, be enough to determine the result of the test?
Just a bit of statistics is enough to get lost
There is no place for that, however, if we’re using the edrone system. We want to answer the question of how many emails should we send in the test phase, in order for our test to provide a conclusion, that is, to determine which of the variants – A or B – is better. It is worth to first learn about some concepts from the field of statistics. Don’t worry – it is not difficult.
On the example of a coin toss we will discuss the concept of a statistical test and the size of the sample needed to carry it out. Let’s start with the statistical test itself.
Firstly: how does a statistical test work? Let’s suppose that we want to check whether a coin is biased or not. We plan an experiment, for example, we decide that we will toss a coin 10 times. We will count the number of times that tails came up and the number of times that heads came up. In the next step we will calculate the probability of our result, that we obtained in the experiment, with the assumption that the coin was not biased. The assumption that the coin is not biased is known as the null hypothesis. We will compare the calculated probability with a certain conventional number telling us how improbable the result of our experiment should be, in order to determine that the coin is biased after all. We would then say that we reject the null hypothesis in favor of the so-called „alternative hypothesis”: the coin is biased.
Secondly: statistical significance – this is the number, which tells us how improbable the result of our experiment has to be, in order to reject the null hypothesis (0 hypothesis) in favor of the alternative hypothesis. On the other hand, this means the percentage of cases in which we will erroneously determine that the coin is biased (the alternative hypothesis), when it in fact is not biased (null hypothesis). This is typically 5%.
Thirdly: the power of the test – this is a number, which specifies how often we will detect a biased coin, with the assumption, that it is actually biased. Normally this is 80%.
The number of attempts (coin tosses), the statistical significance and the power of the test are set before performing the experiment!
An example with a coin: we’ve planned 10 attempts and we’ve also decided on a particular level of statistical significance. As a result of the experiment, we’ve gotten 3 tails in 10 coin tosses. What can we say about that coin? If the coin is not biased (null hypothesis), then such a result occurs in 12% of cases. We have previously set the statistical significance at the level of 5%, which is a lower value. This means that we cannot reject the null hypothesis (coin is not biased) – so we recognize, that the coin is not biased. However, if as a result of the experiment we would only get 2 tails in 10 attempts, we would calculate that the probability of such a result for a non-biased coin is only 4% and we would reject the null hypothesis in favor of the alternative hypothesis: the coin is biased.
It should be added that we usually want to reject the null hypothesis, because it means the occurrence of an effect (e.g. difference of the emails in the A/B test). Therefore, unlike in real life, we will be glad when we demonstrate that our coin is biased.
We have already learned how to carry out statistical tests, so let’s go back to our initial question. How big does the sample size have to be (how many times do we have to toss the coin) in order to be able to determine at the level of statistical significance whether the coin is biased or not. This all depends on how accurate we want to be. The ability to detect a biased coin which gives tails in 99% of attempts, and heads in 1% of the attempts is a different thing, that the ability to detect a coin which gives tails in 60% of attempts and heads in 40% of attempts. In the first case we only need 16 attempts in order to obtain a statistically significant result (that is, indicating the rejection of the null hypothesis) in 95% of the experiments, while in the second case we need as many as 369 attempts.
Before you say RUN A / B TEST
Let’s go back to the A/B tests. First, we want to determine how many emails we should plan to dispatch. Let’s use the calculator from the site. (see: Image 3).
Image 3. Sample size calculator in an A/B test.
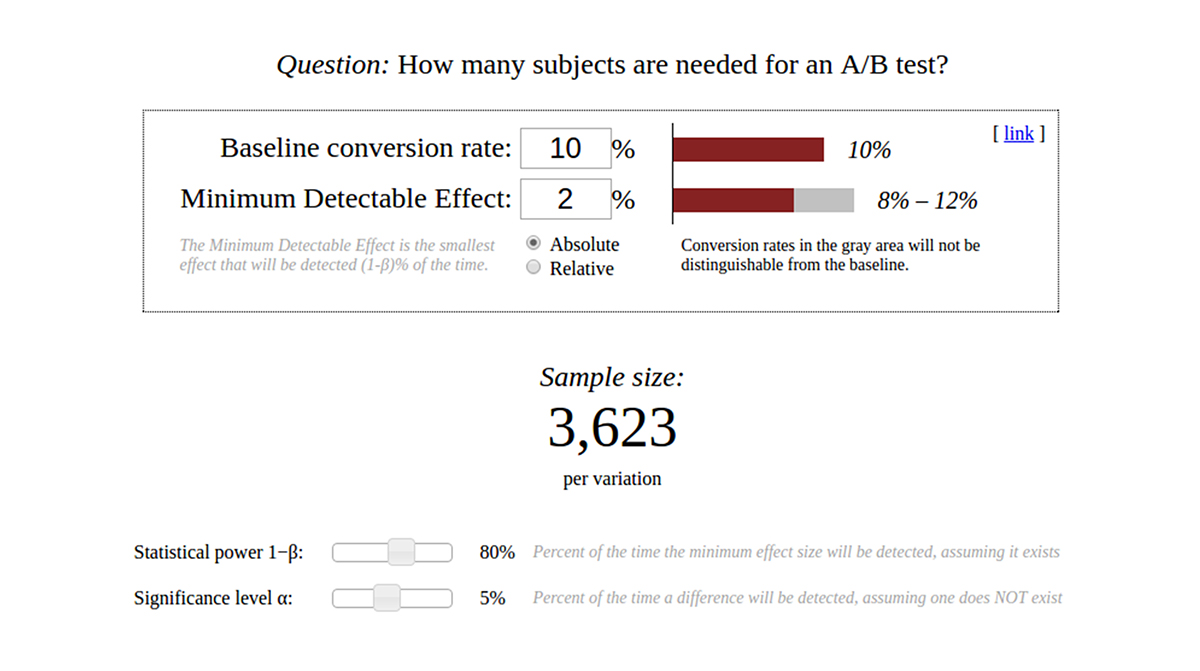
Source: Evanmiller.org, Evan’s Awesome A/B Tools, 7 Nov. 2016, source HERE.
Here’s how to use it:
● Just as in the example with a coin – where the size of the sample depended on whether we have a coin for which tails come up in 99% of attempts and heads come up in 1% of attempts, or a coin in which tails come up in 60% of attempts and heads come up in 40% of attempts – also in this case we need to establish the assumption regarding the expected effect – in our case it is the conversion (the views of products, adding of products to the shopping cart – depending on what we want to measure). In the „Baseline conversion rate” field we enter the expected conversion rate, to which our variants will be compared. Where is this value derived from? It is best to base it on previous newsletters or a study or development presented in the industry press. We suggest setting it at 10%, which is the average value of conversion for our clients.
● In the „Minimum Detectable Effect” field we enter the precision, with which our test will be able to indicate that the A/B test versions (variation) differ from the baseline level. If we have selected a baseline level of 10% at the previous stage and we will set the „Minimum Detectable Effect” at 2%, then in the event the actual conversion rate of variant A is 10%:
○ if the actual conversion rate in variant B is lower than 8% or higher than 12%, we will be able to detect these differences with our test in 80% of cases (80% is the power of the test). In other words, our test will detect differences larger than 2% with an 80% effectiveness, with the assumption that the average conversion rate will be at the level of about 10%.
○ if the actual conversion rate in variant B is in the range of 8-12%, then our test will not detect such a difference and will not allow for rejecting the null hypothesis, stating that the given variant is different from the baseline conversion
○ there is a possibility that hypothesis B can have a 10% conversion, and that A will differ or not differ by +- 2% or more from it – the situation is fully symmetrical
● „Significance level α” is the level of significance, which we’ve discussed previously (usually set at 5%) – it is best to leave the default value.
● the „Absolute” / „Relative” switch determines whether we use percentages or percentage points (it is best to leave „Absolute”)
● „Statistical power 1-β” is the power of the test (usually 80%) – it is also best to leave the default value.
From the calculator we read a sample size value of 1629 per test variant. In the example that we presented at the beginning of this article, we have sent 10 000 emails per variant and calculated that we expect 750 email opens per variant after 24 hours. If our test concerned the conversion from an email open to, for example, a purchase, which occurs with an average conversion rate of 10%, then we should send about 2 times more emails!
At this point we could ask why are we comparing the conversion rate with the baseline level, and not both variants with each other. For the time being, we are not yet checking the test result. The described calculator is used to calculate the sample size and the „Baseline conversion rate” value should be treated as the average value of conversion of variants A and B (which is not known at the time of the test, but we rely on our expertise or knowledge of the experts from edrone).
What happens if a make a mistake in our assumption regarding the baseline conversion? Let’s suppose that the real value of conversion of variant A is 15% and that of variant B is 17%. The average conversion from both versions will be 16%, and the difference – 1%. The calculator will indicate a sample size of 5352 per variant. If we only sent 1629 emails per variant, in accordance with our assumptions, this means that our precision will be too low, to detect the difference between A and B with an 80% chance. On the other hand, we should ask the question of whether we need such accuracy? If the versions differ by just 2% in conversion, with an average level of 16%, then it probably doesn’t matter all that much which version we will eventually send.
All winners are not equal
We are now getting to the crux of the matter. After we have planned with Edrone what percentage of the database we will send the newsletter to, it is time for the dispatch and the results. The results are collected in the A/B summary tab. Below are the results of an actual dispatch, which we’ve carried out from our system.
Image 4. Results of an A/B test.
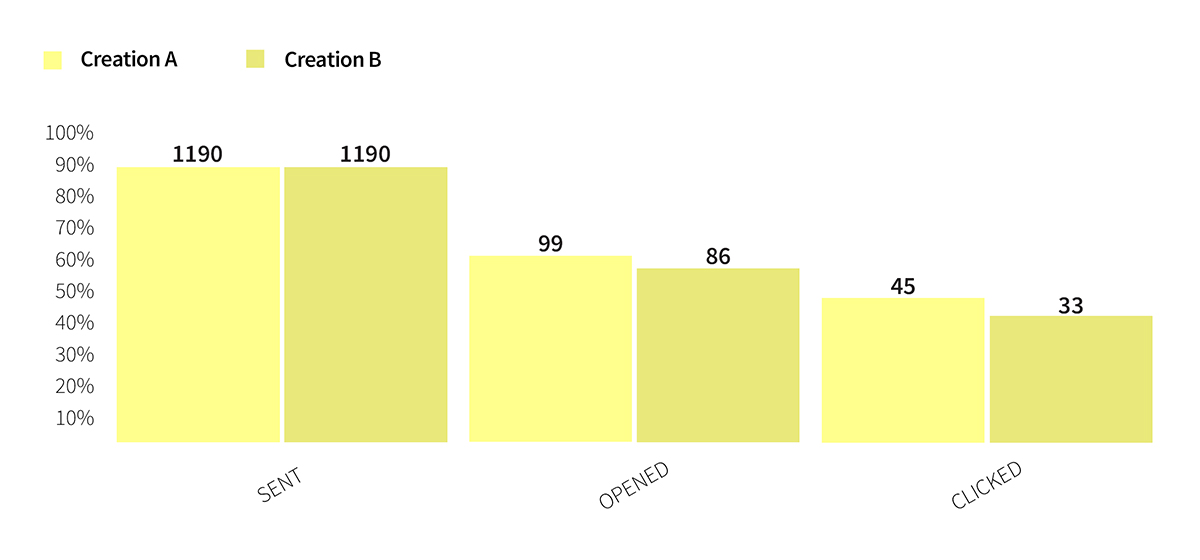
Looking only at the numbers we could think that creation A is winning in relation to creation B. However, when we enter the results to the results calculator it turns out that the difference is not statistically significant (see: Image 5).
Image 5. Assessment of the statistical significance of the difference between test A and b for the number of opened emails.
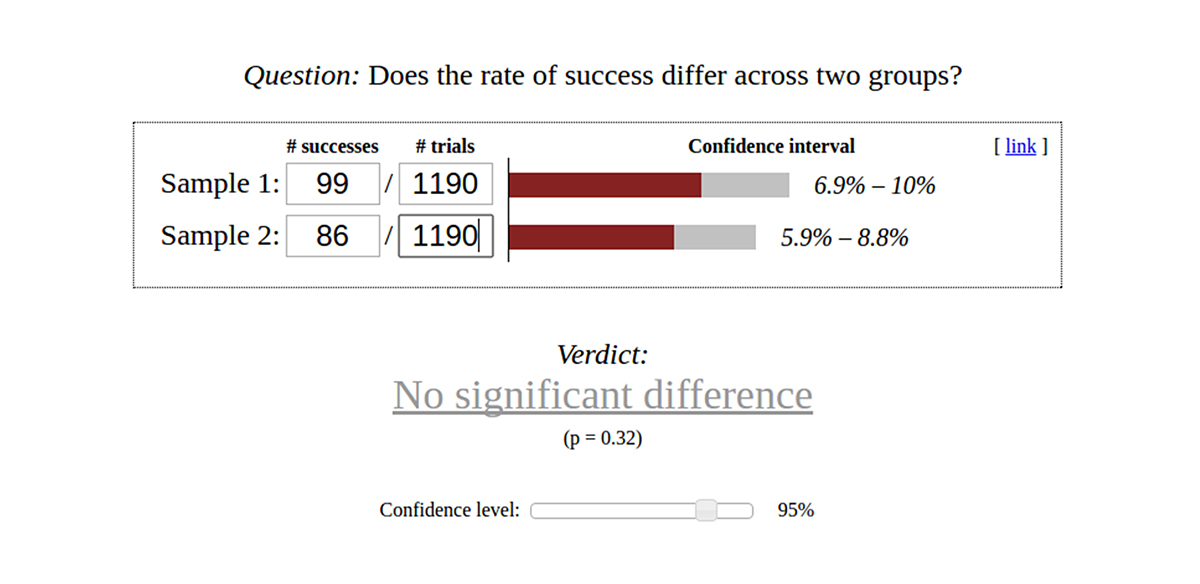
Source: Evanmiller.org, Evan’s Awesome A/B Tools, 7 Nov. 2016, source HERE.
This result should not be surprising, if we reveal that in the discussed examples… the same versions of the email message were tested!
What else should we pay attention to?
1) Some marketing systems used for A/B tests check which option is better not once, after the expiry of an established time period (e.g. 24 hours), but multiple times, for example, every half hour. If the test shows that the difference between A and B is statistically significant, then the A/B test is stopped. This is a mistake! Each performance of the test is associated with a specific error resulting from the established level of significance and the power of the test. If we perform the test many times, until the moment we get a statistically significant result, then every time we introduce an error that adds up with each test. This could be likened to a situation where we would like to prove that we have a coin which falls heads up 30% of the time, and tails up 70% of the time. We would perform the test by tossing the coin and writing down the number of heads and tails that we got up to that point. We would continue until the average of all the tosses would actually be 30% of heads and 70% of tails. Of course, this does not make any sense. Even if the coin is not biased (it is characterized by a 50% chance of falling heads up and 50% chance of falling tails up), with a certain number of attempts it could happen, that the tosses would result in 30% of heads up and 70% of tails up. Checking the significance of the test – without deciding on this basis whether to stop or to continue the test – is not incorrect, but it is a waste of time, because we couldn’t use the knowledge of the test results (if we do not want to make an error).
2) In the case of mailing the audience is limited. The situation is slightly different when we are testing, for example, the landing page, when new users are constantly coming in. We cannot add new recipients once we send the mailing. This means that before sending the message we need to do a calculation: how many users will open our email and whether this number is enough to evaluate the tested versions.
3) The marketing plan typically provides for the dispatch of multiple newsletters in a week. Repeating a test which did not end with a clear conclusion can be a waste of time. This should not stop our further marketing activities. It is better to end the test after 24 hours and carry out the dispatch regardless of the result. If the test did not end with statistically significant results, let’s decide on the basis of experience or intuition – they are often the best sources of advice!
4) Especially since newsletters are usually designed to be sent at a specific date (e.g. on holidays). It is better to send a newsletter that is a bit worse, but is dispatched on time.
5) On the other hand, we should resist the temptation to stop the test too early – if we set a test duration time of 24 hours (duration suggested by us) – then let’s assess the results after that time.
How not to get lost in this?
As we’ve seen, A/B testing is a broad topic. The good news is that you don’t need to memorize all of that, because the edrone system will guide you „by hand”. Moreover, the edrone algorithm will always indicate the winner of the test, and additionally, it will each time check, whether the A/B versions differ statistically and will inform the user. If there is no difference, it is better to rely on one’s own experience or the recommendations of a proven and effective system.
Register on WEBINAR

Maciej Mozolewski
Postgraduate studies in Statistical Methods in Business at the University of Warsaw. Since then, he’s been dealing with the issues of artificial intelligence and machine learning.
Do you want to increase sales and build even better relationships with your customers?